Tuesday, January 13, 2015

Is your home in a coastal floodplain?

After years of talking with community members, residents, and vacationers that live along or visit the coastline, there seems to be a general lack of knowledge on topics such as vulnerability to coastal flooding, erosion hazards, and impacts of climate change on coastal environments. That's understandable - these are complex topics! But what about the most fundamental question of all: "Am I located in a coastal floodplain?". If you are a homeowner, you likely know the answer to this question because if you are in a flood hazard area, your mortgage lender may require you to purchase flood insurance. But maybe you are a renter or just visiting the coast - having dinner at your favorite restaurant known for its great ocean views or you've rented a beach house for a week in the summer. This proximity to the ocean sure is nice but maintaining this infrastructure in the coastal floodplain can be risky business.

Today's post on the California Beach Blog will show you how to search for and view the coastal floodplain mapping at any location you are interested in. Let's get started!

Since the 1970s, the federal government has produced flood maps through the National Flood Insurance Program (NFIP), administered by the Federal Emergency Management Agency (FEMA). According the FEMA's website, "The NFIP offers flood insurance to homeowners, renters, and business owners if their community participates in the NFIP. Participating communities agree to adopt and enforce ordinances that meet or exceed FEMA requirements to reduce the risk of flooding." The purpose of the NFIP is to encourage smart building practices in flood-prone areas. Some may argue that by providing insurance to homeowners in high risk areas, the NFIP has actually enabled development of otherwise too risky areas, but that's a debate for another day. Today I'm going to show you how to download a FEMA Flood Insurance Rate Map (FIRM) for your area and give you the basic information necessary to interpret it.

The first step is to go to FEMA's Map Service Center. You can google "FEMA map service center" or browse to https://msc.fema.gov/portal. Once you're there, enter your location. You can type in an address, place, or lat/lon coordinates. Here, I'm searching for "Capitola, CA".

Type in your location of interest in the search box
Hit the "Search" button and the website brings up a viewer showing your location (Capitola, CA in Santa Cruz County). The website automatically highlights the map panel that contains Capitola, but you can also use the zoom buttons and pan around with the mouse to find your location if it is outside of the highlighted area.

The website pre-selects the panel that contains the location you searched for.

For example, if I'm interested in the waterfront area at Capitola Beach near the Soquel River mouth, I could zoom in just to make sure it is contained in the highlighted area. If not, you can click on the map and the website will reselect the map panel. Here, I've clicked on the beach area.

If the default selection does not contain the location you are looking for you can browse to the correct location, click on the map, and the website will reselect the appropriate map panel.

The next step is to either view the map online or to download the map and view it on your computer. I've found the online viewer to be pretty clunky; however, if you download the map file they can be quite large (this particular panel is about 70 MB). If you only have to view one map, it's probably worth downloading it. If you are going to view a bunch, you may prefer to just view them online.

Once you have the correct map panel selected, you can either view the map online or download the map.

The download file comes down as a zip file, so you will have to unzip it first to get to the image file (a PNG file). If you view the map online, the viewer will open in a new window. I suggest maximizing your browser window and then using the zoom tool to zoom in so you can see the map better. Here, I've drawn a zoom box around the beach and river mouth area.

You can zoom in to your area of interest. Here, I'm zooming in to the Capitola Beach area.
Once you zoom in to the right level, you can really start to see some of the information and labels for your area of interest. Here, I've enlarged the boxed area from above. There are a few key labels to note, which I'll explain in more detail below. First, the areas shaded in blue or black are areas that are in FEMA's Special Flood Hazard Area. If you aren't in a blue or black area, it doesn't mean that you have no risk of flooding, it just means that you are not mapped in FEMA's regulatory floodplain. The second level of information are the labels "Zone AE" and "Zone VE". These designations tell you the type of flood hazard in each area. Finally, the numbers on the map (17, 19, 20, 22, etc) indicate what is called the "Base Flood Elevation", which is the elevation of the floodwaters associated with FEMA's regulatory storm of choice - the 100-year or "1-percent-annual-chance" flood.


So now for some more detail:

  • Special Flood Hazard Area - The blue and black shaded areas are "in" the floodplain. The blue areas are subject to flooding during a 100-year storm and the black areas are subject to flooding during a 500-year storm. I'm using the common terminology for FEMA's design storm (the "100-year flood") but technically the "1-percent-annual-chance" storm is the more correct term. The difference in terminology is because the 100-year storm is not a storm that happens only once every one hundred years. Instead, it is a storm event that has a 1% chance of occurrence in any given year. That may sound low, but due to the effects of cumulative probability, the chance of experiencing a 100-year flood over a time period of 30 years is roughly 25% (see my post on Encounter Probability for more information).  And finally, just for the record, if you are mapped in the 500-year floodplain, you are still vulnerable to flooding and may want to consider purchasing flood insurance! Ask anyone who survived Hurricanes Katrina or Sandy, both of which were more severe than a 100-year event...
  • Zone Designations - Fortunately, this map only has two zone designations - Zone AE and Zone VE. The "V" in VE indicates a high velocity zone, either due to strong currents or wave action. The AE zone indicates inundation only (or inundation with small waves). The "E" indicates that the area has an assigned Base Flood Elevation (or BFE, see next bullet). There are other areas (like to the east of Capitola) that have either a generic "V" Zone or "A" Zone. In these areas, the flood hazard area is shown on the map but there is no published flood elevation, so less information is available. Other designations exist (for example, zones which indicate depth of flooding but not and elevation), but the VE and AE zones are the most common.
  • Base Flood Elevations - The numbers shown on the map are key because they tell you to what elevation flood waters are predicted to rise during the 100-year flood. Elevations on newer maps are reported relative to the North American Vertical Datum of 1988 (NAVD88). Older maps typically reported elevations relative to the National Geodetic Vertical Datum of 1929 (NGVD29). Along the California coast, elevations relative to NAVD88 are typically 2.5 to 3 ft higher than in NGVD29.
If you live in an area where elevated homes were common, you would be required to elevate your home (on stilts for example) above the BFE to minimize flood damage. It is, of course, possible that flood waters will exceed this elevation during extreme events so it is up to a homeowner to decide what risk they are willing to take. In Capitola, the western portion of the beach shows a wave runup elevation of 22 ft and the eastern portion of the beach shows a wave runup elevation of 19 ft. Landward of the coastal flood hazard area, the blue shading merges with the Soquel River flood hazard area and the base flood elevations increase from 15 ft to 17 ft to 19 ft to 20 ft, etc. as you move upstream.

Along the California coastline, the base flood elevation typically represents the wave runup elevation at the shoreline. In some sheltered areas with small waves, the limit of inundation may be shown as an AE Zone only (such as Bolinas Lagoon), which indicates that the area is generally sheltered from wave action but may be subject to tidal flooding.

Let's look at a couple other examples:

Here's the inundation floodplain in Bolinas Lagoon that I mentioned above. As you can see, there is no V Zone (which would indicate the potential for damaging storm waves) and instead the Special Flood Hazard Area is shown as an AE Zone with elevation 8 ft.


Here's the coastal floodplain mapping along Beach Drive in Rio del Mar. There is a VE Zone at this location with a base flood elevation (wave runup elevation) of 24 ft. As you can see, all of the homes built along the back of the beach here are vulnerable to coastal flood damage.


So there you have it. If you want more detailed information, there is a 50-page tutorial on FEMA's website, titled How to read a flood insurance rate map but I hope I've provided enough information here to get you started. Also keep in mind that FEMA is currently updating the coastal flood maps for the entire state of California - so your map will soon change (for the better - the new maps are based on new data and state of the art analysis and mapping techniques).

Please leave a comment if you have any questions.

Sunday, November 23, 2014

November afternoon at Ocean Beach - first video

On Saturday afternoon I headed out to Ocean Beach to practice using the video functionality of my Nikon D7100. It was sunny at my house on the Panhandle but by the time I got out to the Inner Sunset it was grey and misting! I thought I saw clearing clouds to the west and sure enough by the time I got to the Great Highway it was sunny and warm, although a bit windy. The storms clouds were headed eastward and I was in for a perfect fall afternoon at the beach.

I opened my trunk to get my camera and tripod only to discover I was missing the plate that attaches the camera to the tripod! Ahhh! I guess my first video attempt was destined to be a shaky hand-held operation.

I had been experimenting with the video settings the night before and had the camera in monochrome mode. I turned the camera on and liked what I saw and the black and white colors seemed appropriate for a post-storm November outing so I left the settings as is.

I left the camera in aperture-priority mode and for the most part the camera behaved like I wanted. The focuses proved to be the trickiest aspect because it was hard to see the live display on the back of the camera due to the glare so I couldn't always tell if the image was in focus.

I tried to follow some guidance I had read online of shooting a few 10-second clips and then editing them together at the end. I tried to vary the shots - some landscape, some details, some personal.

When I got home I still didn't have a viable option for the video editor! I did a little research online and downloaded the Microsoft Movie Maker, which proved to be just the right balance of simplicity and functionality for me to stitch together the clips, add transitions, and overlay a soundtrack.

Hope you enjoy!


Ocean Beach from California Beach Blog on Vimeo.

Monday, August 11, 2014

Exploring the Devil's Slide Coastal Trail

After driving the narrow coastal road along Devil's Slide for years, I was very excited for the opening of the bypass tunnels in 2013. Construction of the tunnels was a major victory for environmentalists who had opposed construction of an inland route over Montara Mountain since the late 1950s. In addition to celebrating the opening of the tunnels, we can also celebrate the opening of a new coastal access trail which runs for 1.3 miles along the old HWY 1. The Devil's Slide trail is also part of the statewide California Coastal Trail. We visited the new trail in June 2014.

The northern entrance to the Tom Lantos Tunnels, completed in 2013.
We started our hike from the Pacifica side of the tunnels. The parking area is relatively small and we secured the last open spot (there is more parking available at the south end of the tunnels). There is a bathroom and water fountain at the start of the path, which slowly climbs upwards for about a quarter mile. The path accommodates both pedestrian and bike traffic.
The northern start to the Devil's Slide Coastal Trail.

We saw these interesting looking plants all along the first section of the trail. I believe they are called Pride of Medeira and are fairly common along the central coastal areas of California.
Pride of Medeira flowers along the trail.

We soon came upon a nice landscaped overlook with expansive views across the Pacific. It was a little hazy but I bet on some days you can spot the Farallon Islands in the distance.


To the north we could see the rocks of Point San Pedro and the San Andreas fault line far in the distance. I believe the terraced bench seen running along the cliff in this photo is the old Ocean Shore Railroad grade. The railroad was originally planned to extend 73 miles from San Francisco to Santa Cruz; however, the 1906 earthquake caused extensive destruction and delays. The tracks were never completed and the Ocean Shore Railroad went bankrupt in 1921.

Point San Pedro visible to the north from the trail.

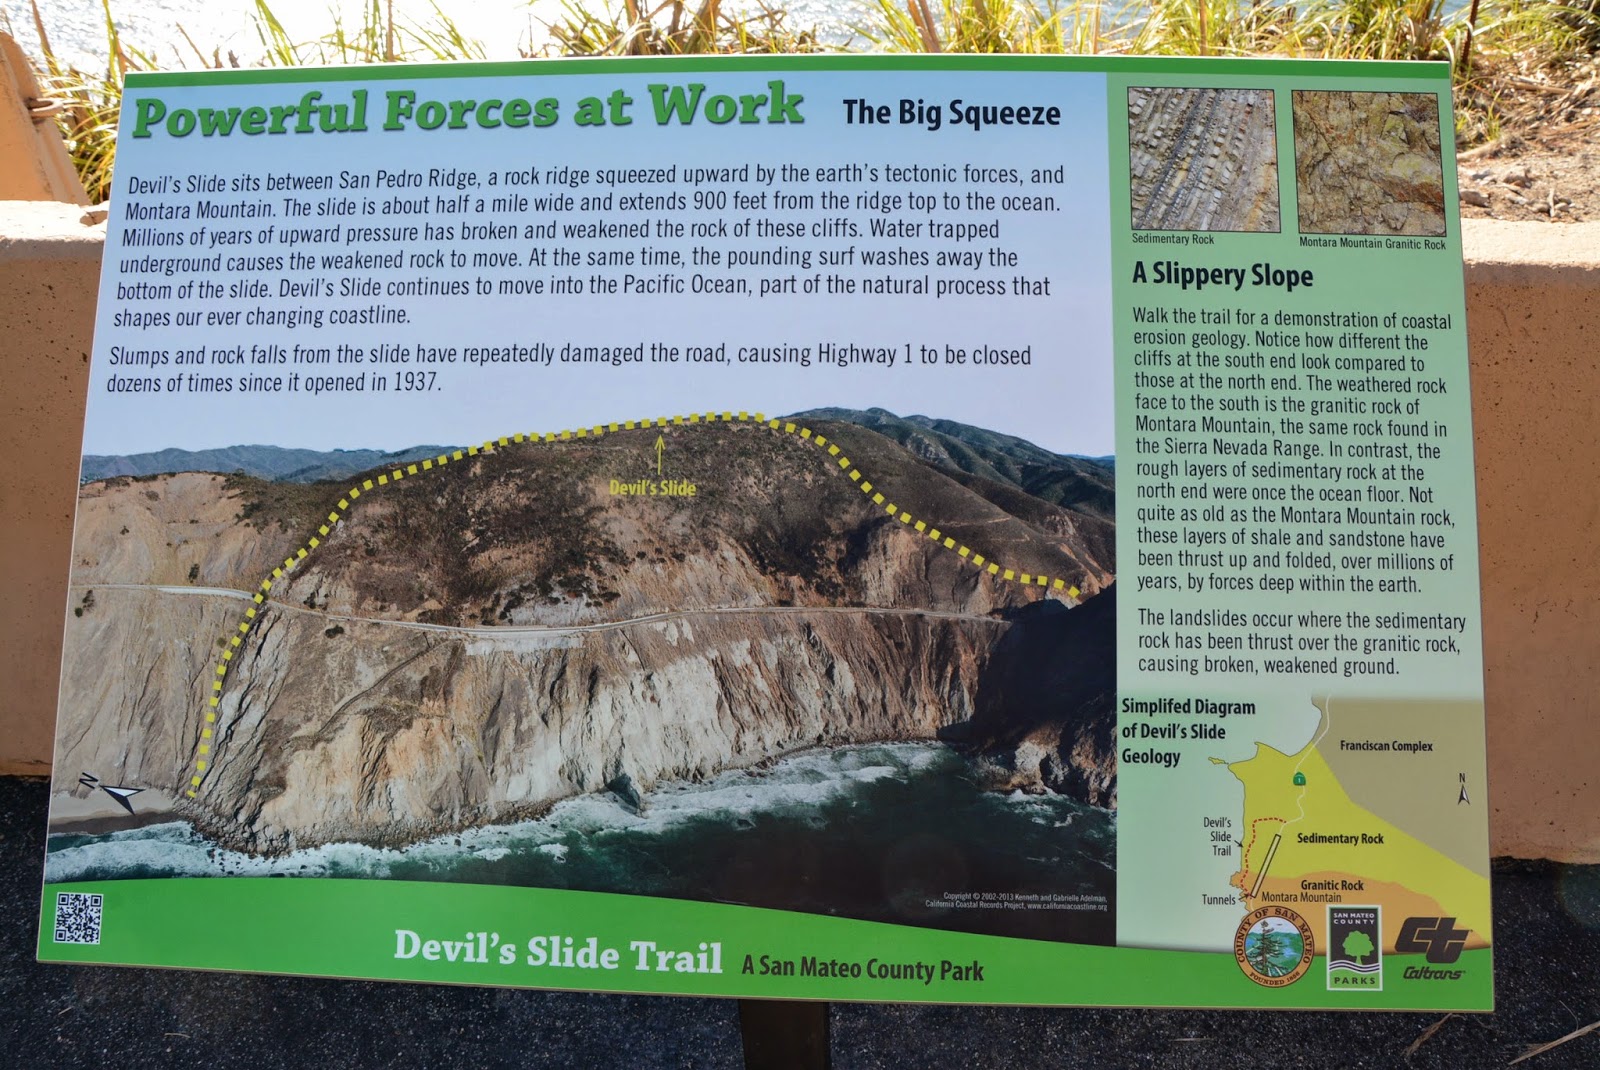
This stretch of coastline between Point San Pedro and Montara Beach is well known for its unstable geology and steep coastal cliffs. Waves erode the base of the bluffs which makes them susceptible to landslides.


The northern half of the area consists of deformed and fractured sandstones and shales which are prone to rockfall and slides (Griggs et al. 2005). The unstable rocks can be seen perched above the roadway.

Unstable sandstone and shale above the roadway.

The bedded layers of sandstone and shale rock are easily visible along the roadside. A geologist's dream! These rocks were formed during the Paleocene, approximately 60 million years ago.


Barriers along the road help keep rocks from falling down onto the path. It's hard to believe the state was able to maintain this section of road for so long!


In addition to the barriers on the road, the state has constructed an extensive system of slope stabilization and drainage to lower groundwater levels over the past decades to help secure the slope.

Slope stabilization measures along the Devil's Slide coastal trail.

As you make your way to the south towards Montara, the rock transitions to deeply weathered but more stable granitic rocks (also known as Montara granodiorite). These granitic rocks are similar to the granite outcrops at Bodega Head and Point Reyes, which have been transported northward on the Pacific Plate from their place of origin in southern California (Hayes and Michel 2010).

Drainage pipes are part of the state's efforts to stabilize the slope. A former WWII military emplacement to spot enemy ships is visible on the hilltop in the distance.

This photo from the California Coastal Records Project (californiacoastline.org) shows the precarious HWY 1 along Devil's Slide running high above the Pacific Ocean. Various drain pipes and slope stabilization measures are visible in the photo.

HWY 1 along Devil's Slide. Source: California Coastal Records Project.

As we continued, the views did not fail to impress and there were abundant wildflowers along the ridge below the trail.


At two locations along Devil's Slide, old military emplacements can be seen keeping watch over the Pacific. Eight-one stations were built along this stretch of coast from Point Reyes to Half Moon Bay between 1892 and 1949 to spot and triangulate the positions of enemy ships off our shores.


At the far south end of the trail, a view of Montara Beach emerges. Montara Beach is a wonderful unique beach definitely worth a visit!

View of Montara Beach to the south from the Devil's Slide Coastal Trail.

Until next time... Keep exploring!